Note: Precipitation amounts from this year were supplemented with data from the National Weather Service when local amounts were not available.
It was a bumpy road when it came to 2023’s precipitation totals. Yet, in the end, this year’s moisture total looks pretty similar to 2022. Last year, local reporters measured 19.91 inches of precip. And despite this year’s seemingly extreme swings, we came in at 20.23 inches in 2023. This total put the area on par with the 100 year average of 20.04 inches of moisture.
The year started a bit drier than normal with minimum precip measured in January following harsh December storms. The precipitation totals in the first five months, due in part to storms in March, came in as wetter than the average for those months. March of ’23 saw over an inch extra of moisture compared to that of 2022.
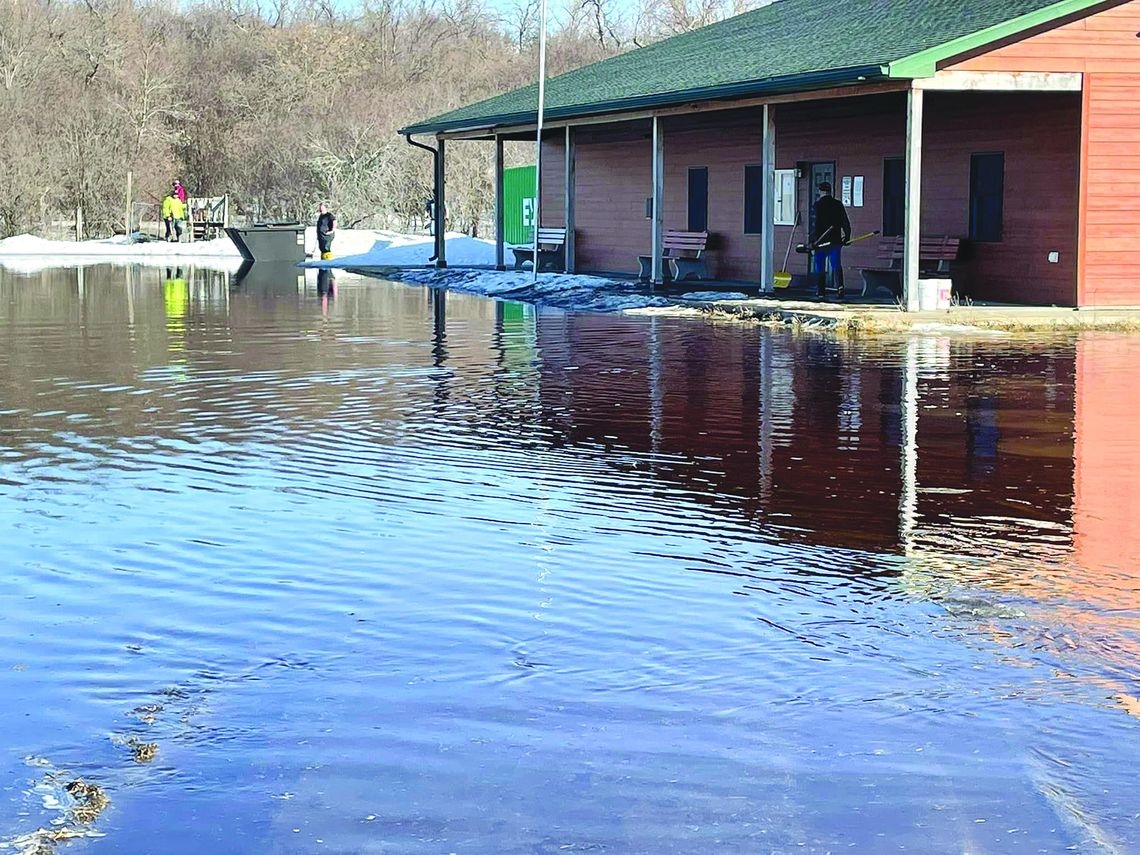
April proved to be a wet month though it was more so due to snowfall than April showers. 3.16 inches of precip was totaled for that month. With a quick warm up, this led to flooding throughout Journal Country that ultimately resulted in a state and federal disaster being declared. Though April was damp, it was still significantly lower in moisture than last April where a near record was set. (In April of 1986, 7.27 inches were recorded).
In May of this year, Journal Country was drier than normal at 1.8 inches of wetness, significantly less than last year’s May total of 4.78. The average for May is 2.76 inches. The documented record for that month in the area was just over 8.5 inches of rain measured in May of 1905.
The next month’s saw a great deal of variation as moisture totals peaked and valleyed. June’s 3.17 inches was less than the 100 year average of 3.75. July’s .88 inches of rain was significantly below the average of 2.88 inches. (10.64 inches of precip was recorded in July of 2018). August finally saw a few soakers with 3.9 inches of precipitation, above the average of 2.43. The wettest recorded August was in 1942 when over 10 inches were recorded.
September and October saw 1.65 and 1.49 inches of rain respectively, much more than those same bone dry months in 2022, with .18 and .07 inches of moisture. The averages are 2.04 and 1.35 for those months. September’s record for moisture was 1921 with 6.66 inches and October’s record is around 6 inches in 2008.
An extended fall and dry temperatures marked November with only .47 inches of precip, below the .77 inch 100 year average. Unlike December of 2022, the snows held off for most of the month but eventually 1.25 inches of moisture resulted from the rain and snow, topping the .41 inch average. 2005 is the wettest December on record with a whopping 6.13 inches recorded.
The moisture levels throughout this year led to a fair share of headaches, including a wet planting season. This gave way to dry conditions in the latter part of the growing season leading farmers to pray for rain. Yet, overall yields were better than expected.


